About the Graphing Lab: Functions & Transformations simulation
The Graphing Lab teaches graphs the way a teacher builds them on the board: first by plotting points, then by learning the shapes of the standard functions, then by moving those shapes with transformations. Every curve is drawn from the real function, so 1/x is never joined across x = 0, √x starts exactly at the origin and x^(1/3) is drawn for negative x while x^(1/2) is not. The live equation under the board is the same expression that is being plotted.
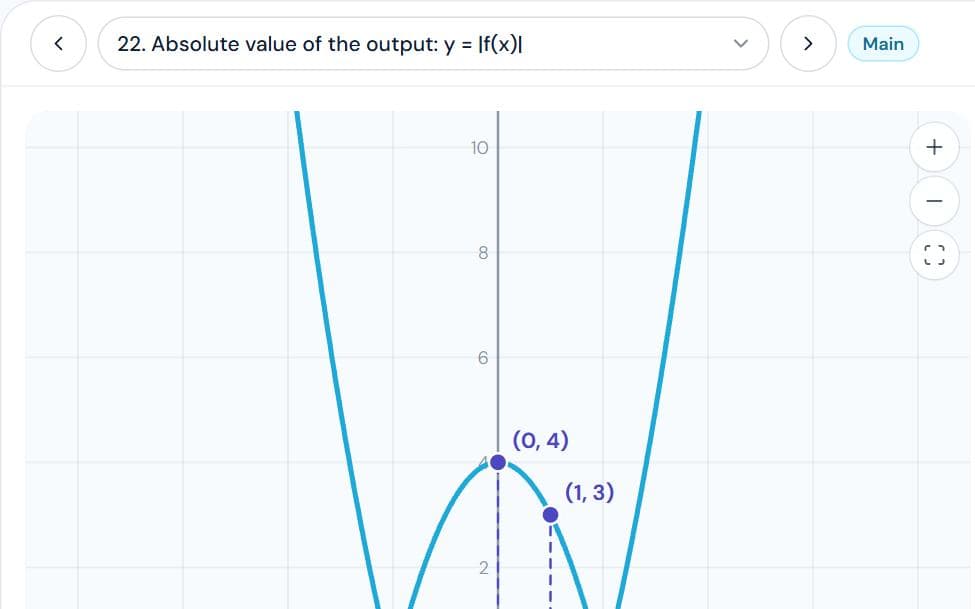
The thirty-one lessons run in five parts. Plotting points covers the coordinate plane, tables of values, why a curve needs more than a few points, and reading intercepts, domain, range and symmetry off a graph. Standard functions covers aˣ, logₐx, even and odd powers, 1/x and 1/x², x + k/x, the bounded rationals x/(1 + x²) and 1/(1 + x²), even and odd roots and the general power xᵖ. Transformations covers f(x) + a, f(x − a), a·f(x), −f(x), f(−x), |f(x)|, the modulus function, f(|x|), |y| = f(x), f(ax) and moving the axes. In each one the original graph stays in grey, landmark points carry arrows to their images, and Play slides every point of the original to where the rule sends it.
The last two parts put it together. Build a graph step by step animates targets such as y = −2(x − 3)² + 4 one operation at a time; Order the steps yourself gives the challenge ladder from y = (x − 2)² + 1 to y = |x² − 4| and checks the student's sequence against the target; Guess the transformation shows a target graph without its equation. Your own function lets a student type any f(x) and apply every transformation to it. Each lesson has a prediction question, a derivation and randomised practice with worked solutions.
Also covers: graph transformations, transformation of graphs, graphing functions, plotting points, table of values, coordinate plane, quadrants, exponential graph, logarithmic graph, reciprocal function, 1/x graph, x + 1/x, even and odd functions, square root graph, cube root graph, modulus function, |f(x)|, f(|x|), |y| = f(x), f(x) + a, f(x - a), af(x), f(ax), reflection in x axis, reflection in y axis, horizontal shift, vertical stretch, inverse function graph, domain and range, asymptotes, custom function grapher.